Vendee Globe
Project Overview:
To date, the Vendée Globe is the greatest sailing race round the world, solo, non-stop and without assistance, various sailors travel the seas. The competitors undertake a circum navigation via the three capes (Good Hope, Leeuwin and Horn). The Vendee Globe is now called the Everest of the seas and is an extraordinary race.The 9th edition of the Vendee Globe was held in 2020-2021 and was won by French sailor Yannick Bestaven who took slightly over 80 days to sail non-stop around the globe. During the race, spectators could follow the action live on an online racing dashboard
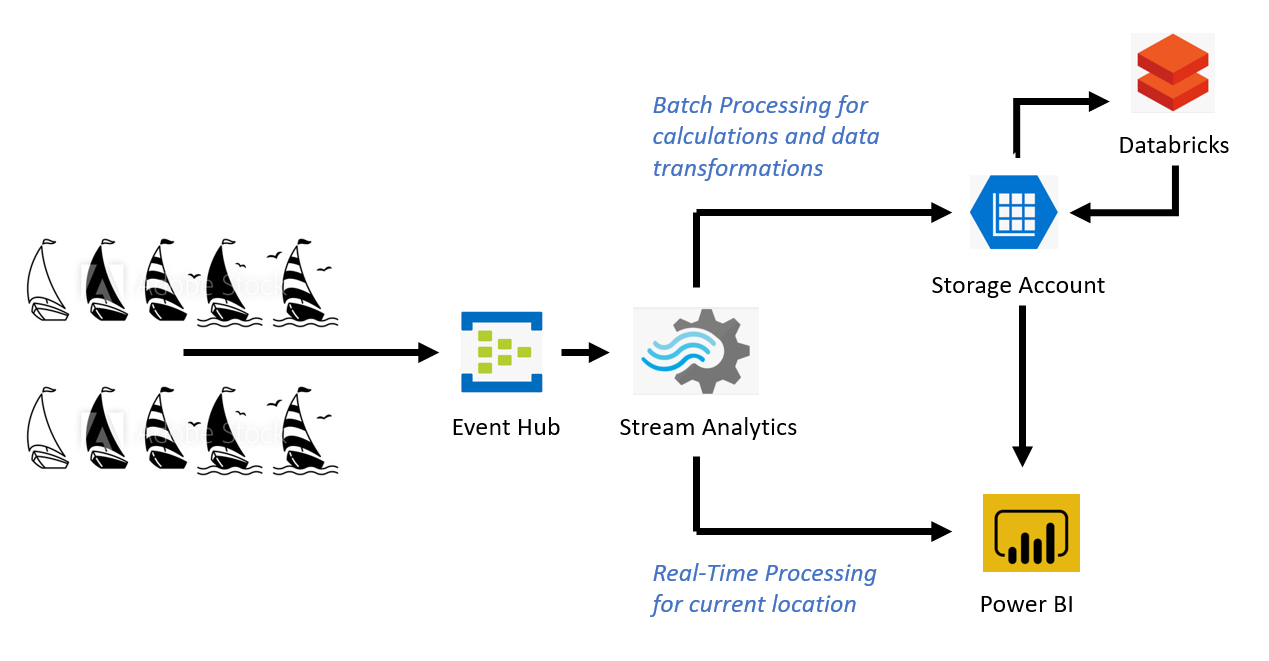
In order to visualise this race, I created a Lambda architecture. A real-time stream to display the current location of the sailors at all time. And a batch layer to calculate rankings, total kilometers travelled, average speed, and so on.
Project Requirements:
The boats leave from South of Portugal. They head south-east around the globe, sending data about their location every 60 seconds.
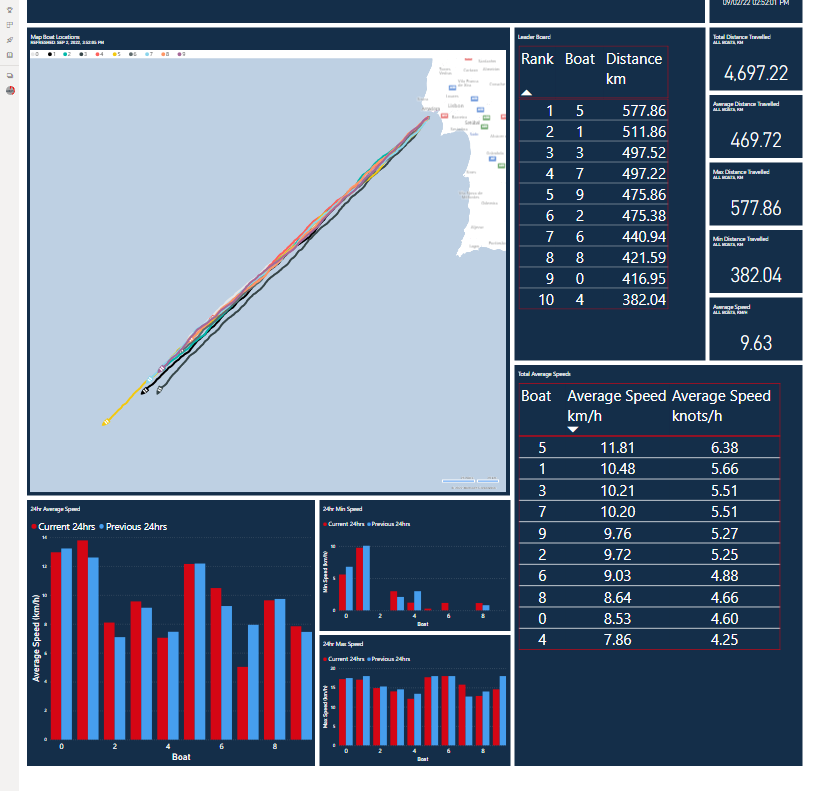
The Lambda Architecture should send all boat data to a PowerBI dashboard. The dashboard should display a world map with the current position of each boat, and a table with a ranking of racing teams. The ranking table should be sorted by who is currently in the lead.
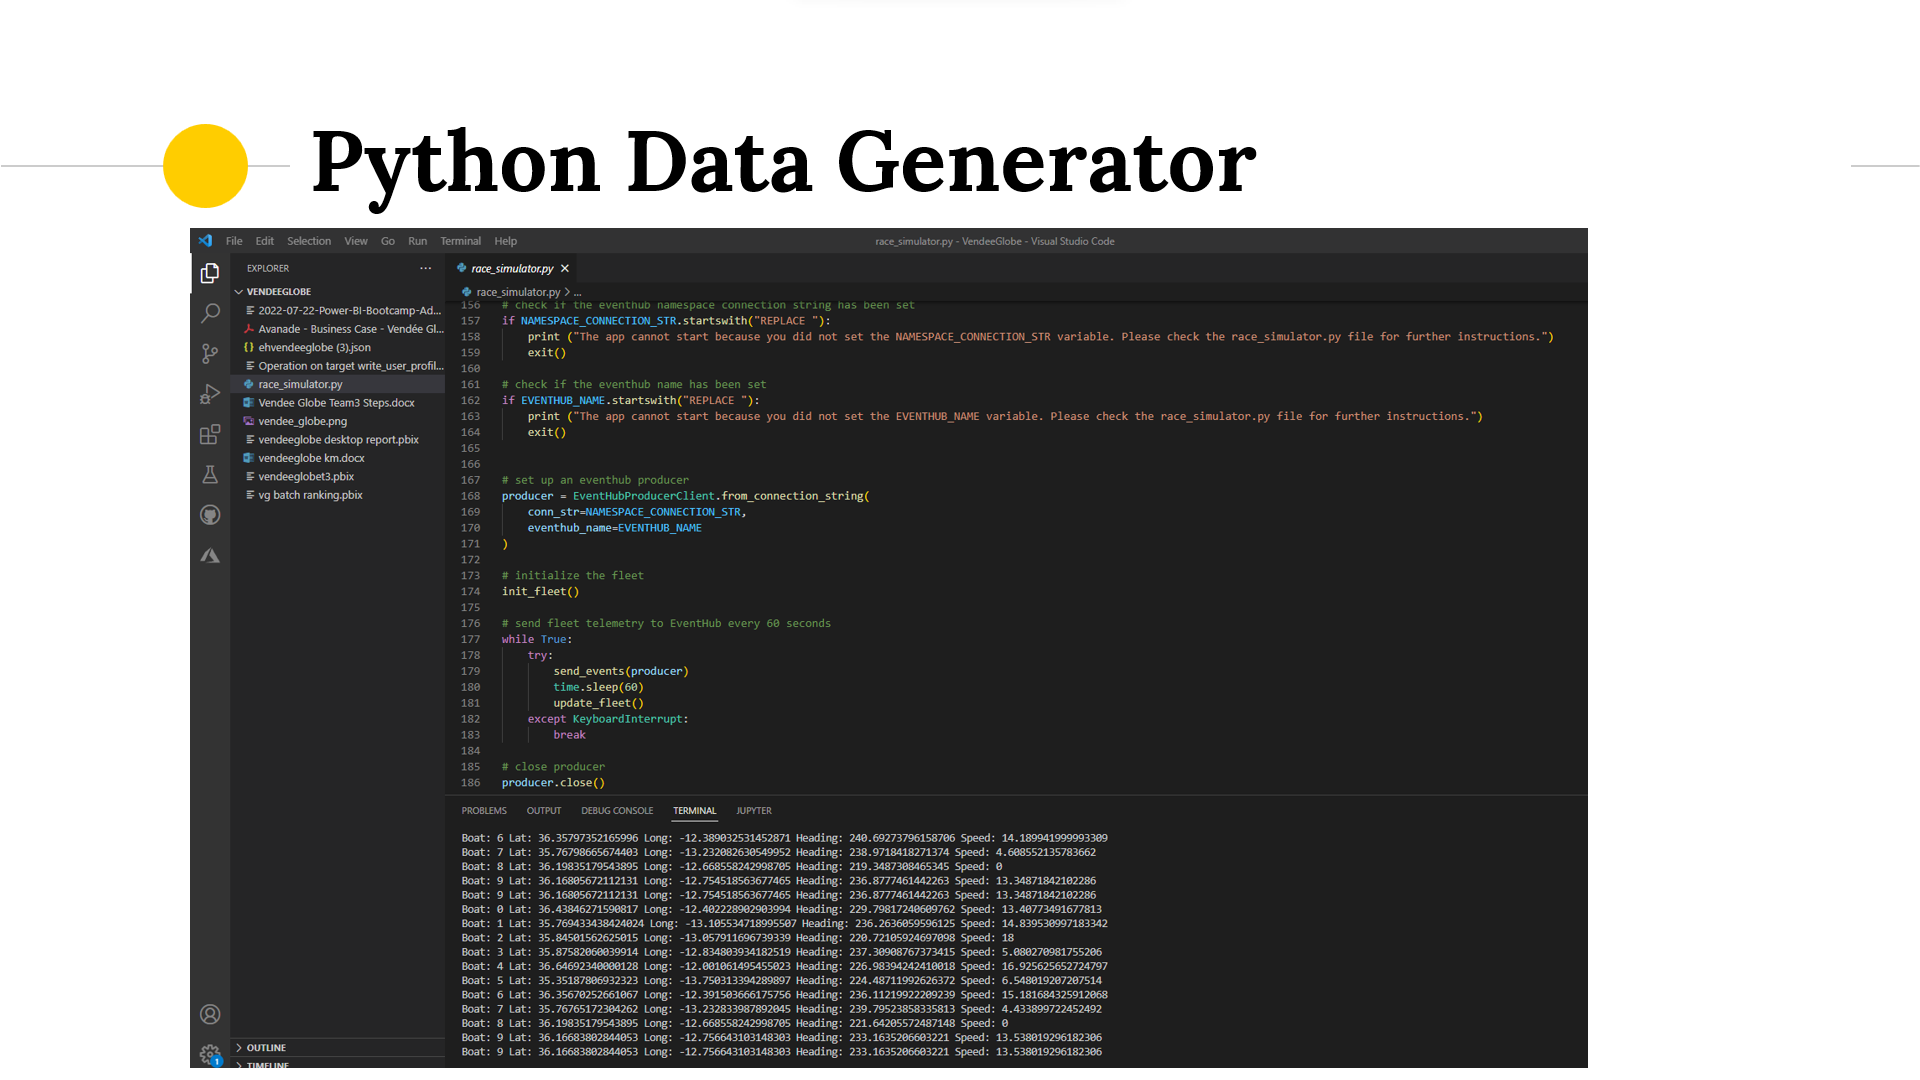
Currently the races are not happening, so unfortunately I cannot use the actual data from the boats participating in the race. Instead, use a phyton simulator that will simulate boat telemetry data from a fleet of 10 race participants.
1)Create a Lambda Architecture in Azure with a real-time path and a batch-processing path. Your architecture should include an Event Hub, a Stream Analytics Job, and an output to PowerBI. Your batch-processing path can use any data storage service you prefer: a Data Lake, a SQL Database, a Cosmos database, or a Synapse Analytics Workspace.
2)Create a PowerBI dashboard that displays a world map with the current location of each racing team, and a table with the teams ranked by position in the race.
3)Download the Python race simulation app to your local computer. Configure the app to send data to your EventHub.
4)Start the Python app. Every 60 seconds, the telemetry of the simulated racing boats will be sent to your Azure cloud.
Challenges
During the Project, addressed several challenges:
The Python app occasionally produces garbled data. I need to ensure that only clean data arrives in the PowerBI dashboard? How am I going to calculate the ranked list of sailing teams? How will I calculate who is ahead in the race? Which data service am I going to use for the batch-processing path in the Lambda Architecture? How will I present our data in the PowerBI dashboard?Results and Achievements:
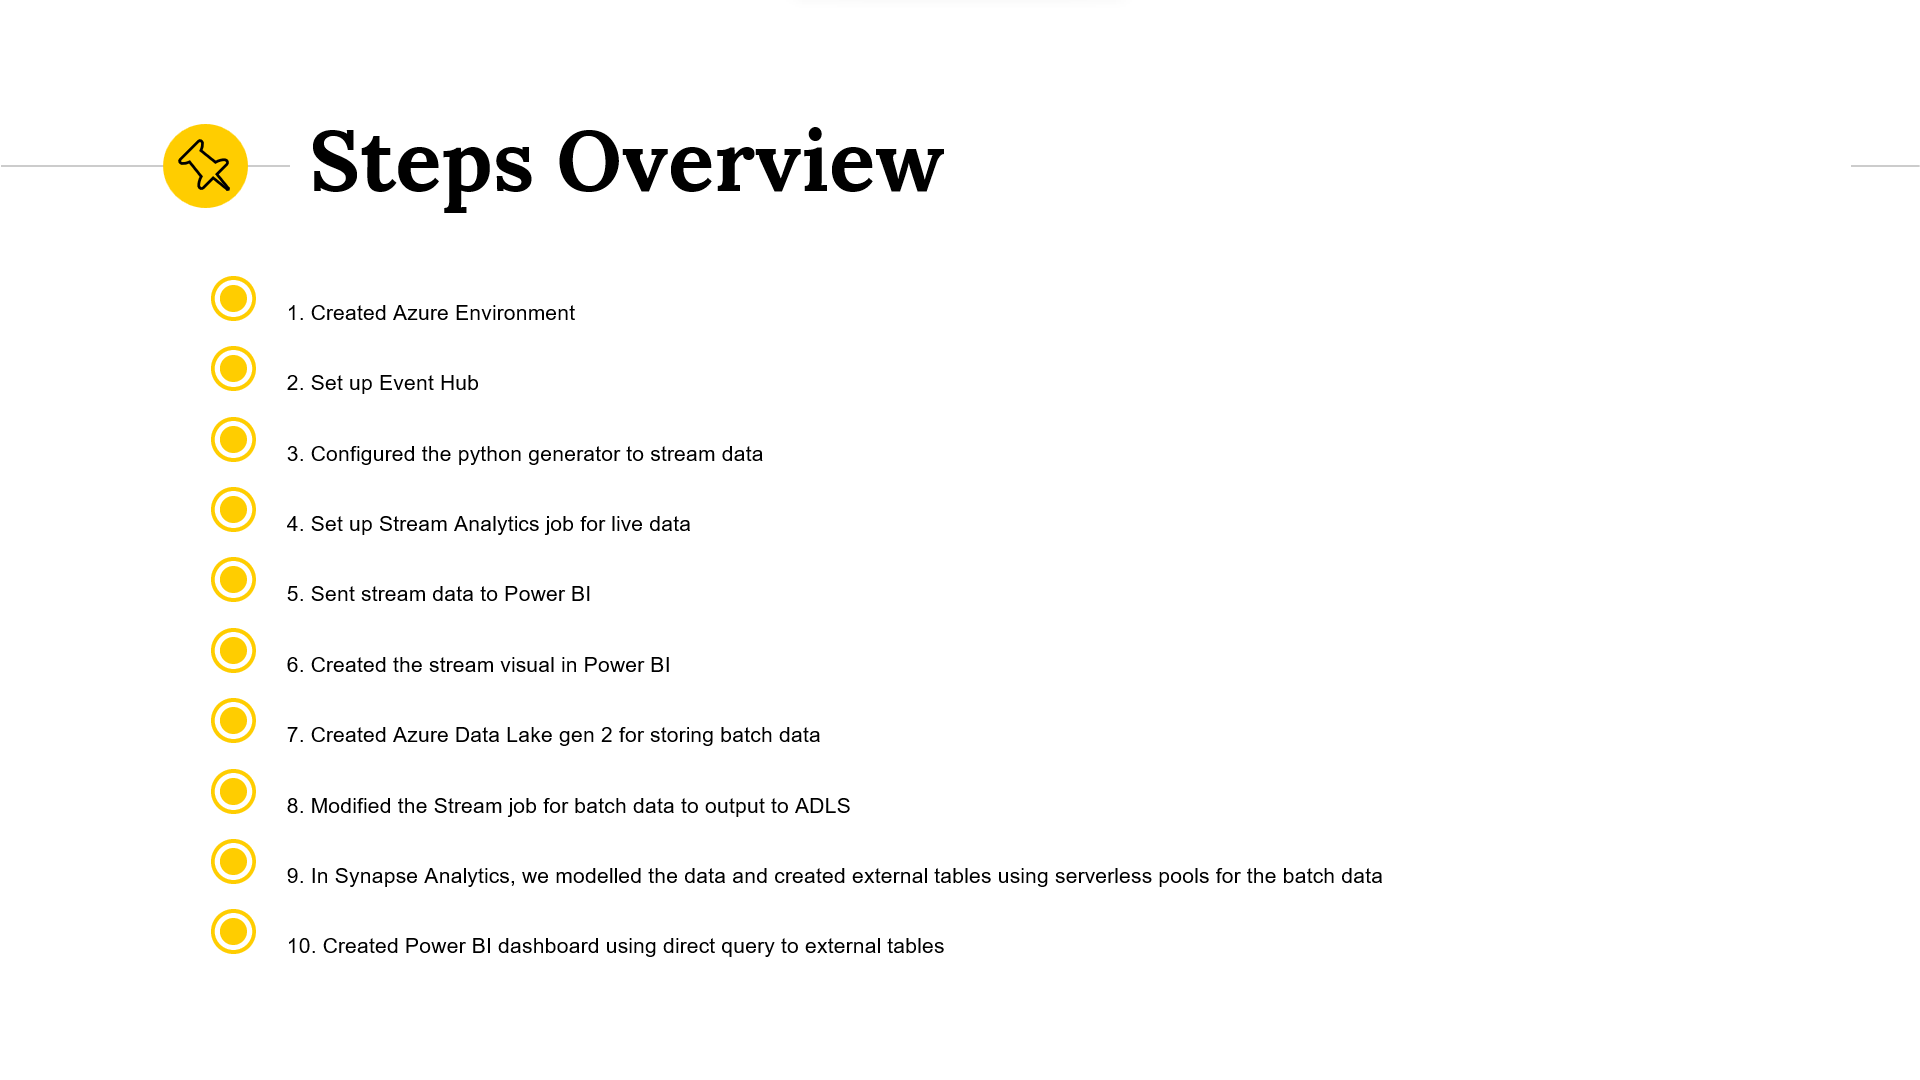
How did I acheive this?
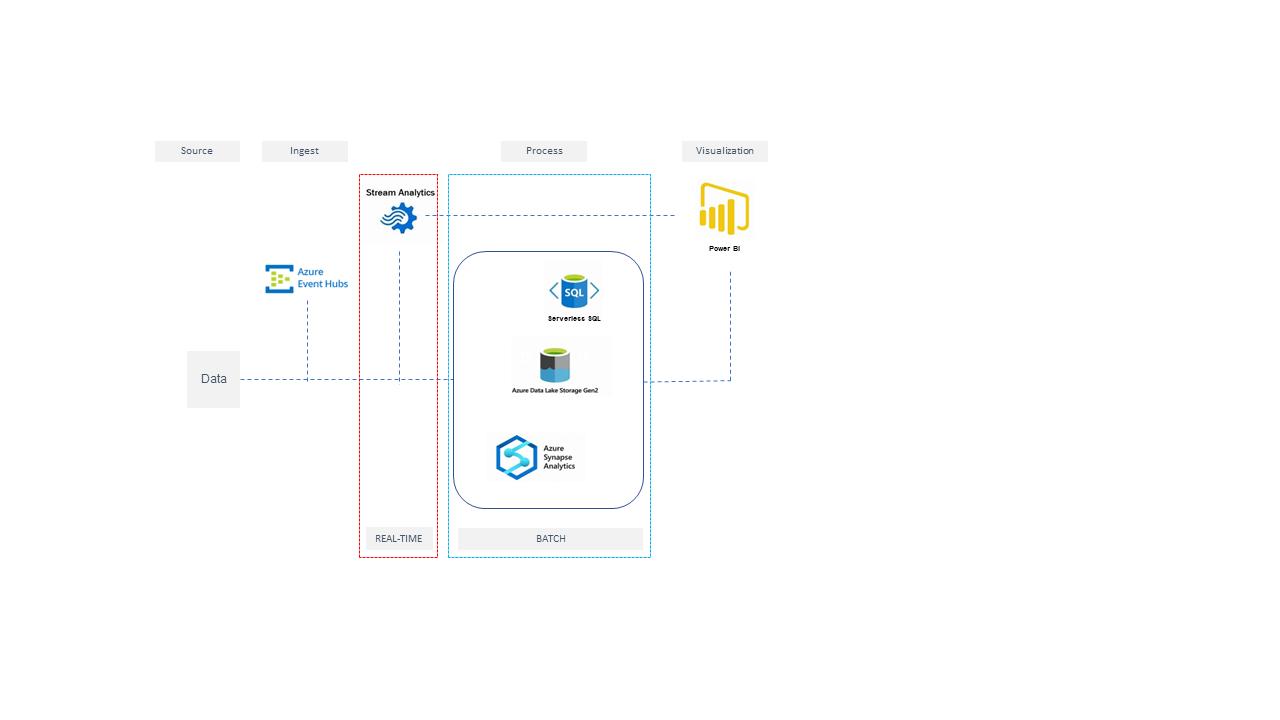
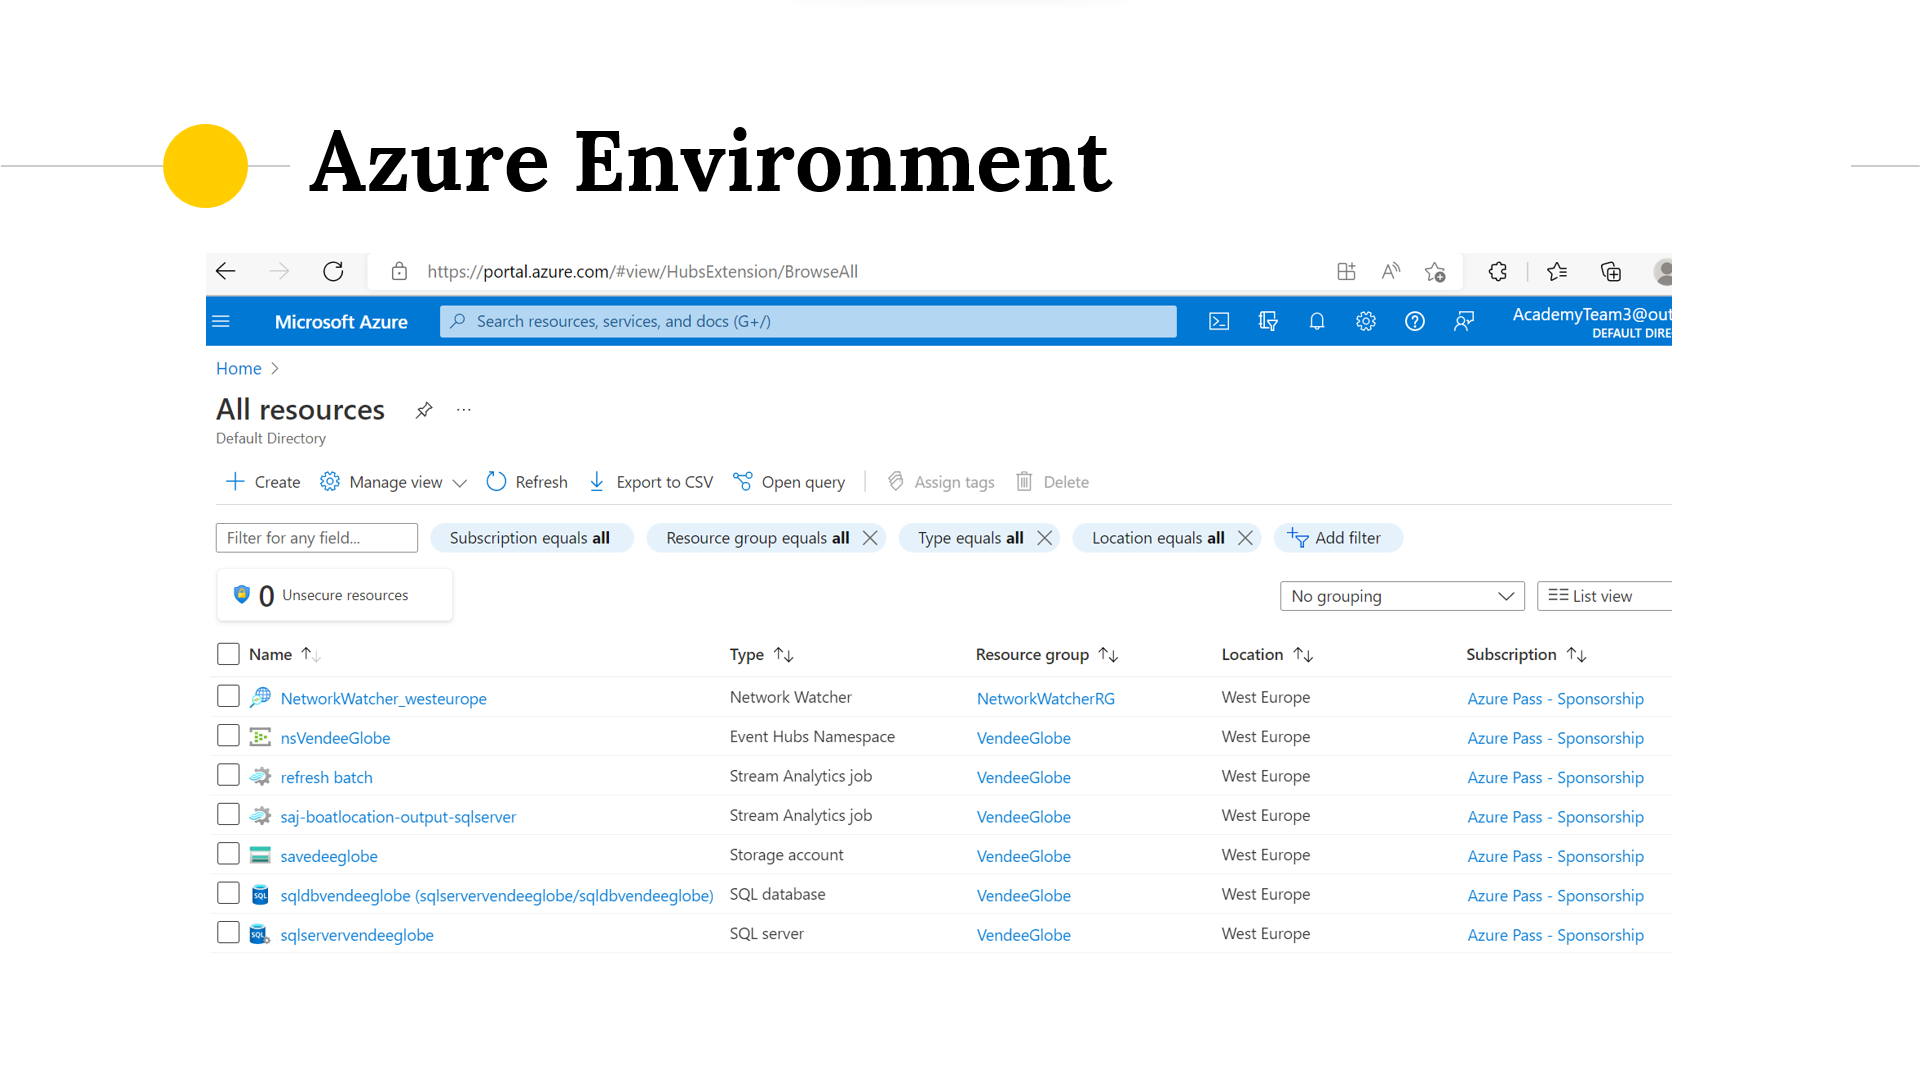
Started off looking at various options and decided on the following architecture
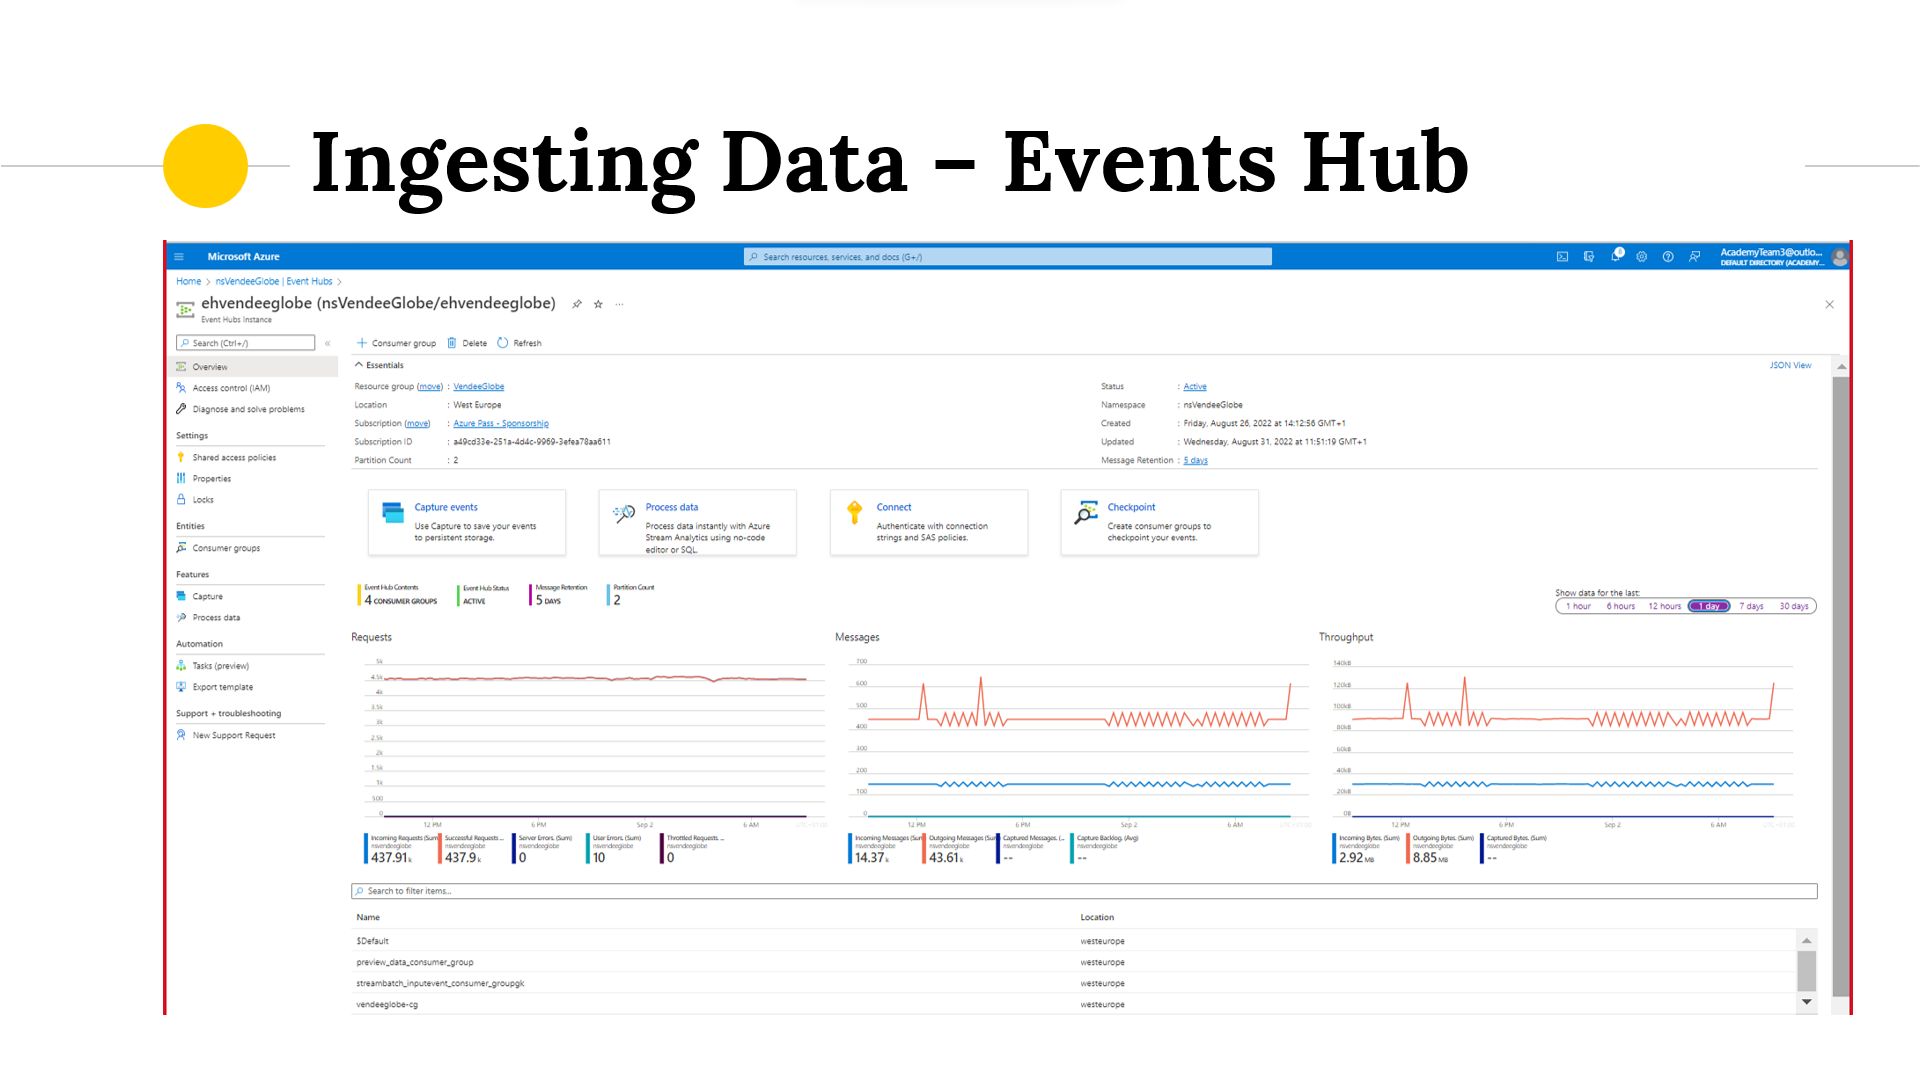
An Event Hub for collecting sailing boat data. Phyton simulator was used to stream data to event hub
A Stream Analytics Job for processing the data in real time (hot tier) and in batches (cool tier)
Data Lake Gen2 for low cost storage
Synapse serverless pools for collecting data batches and preforming batch calculations for ranking and for fun we added in other calculations for speed
A Power BI dashboard for displaying both real time and batch data
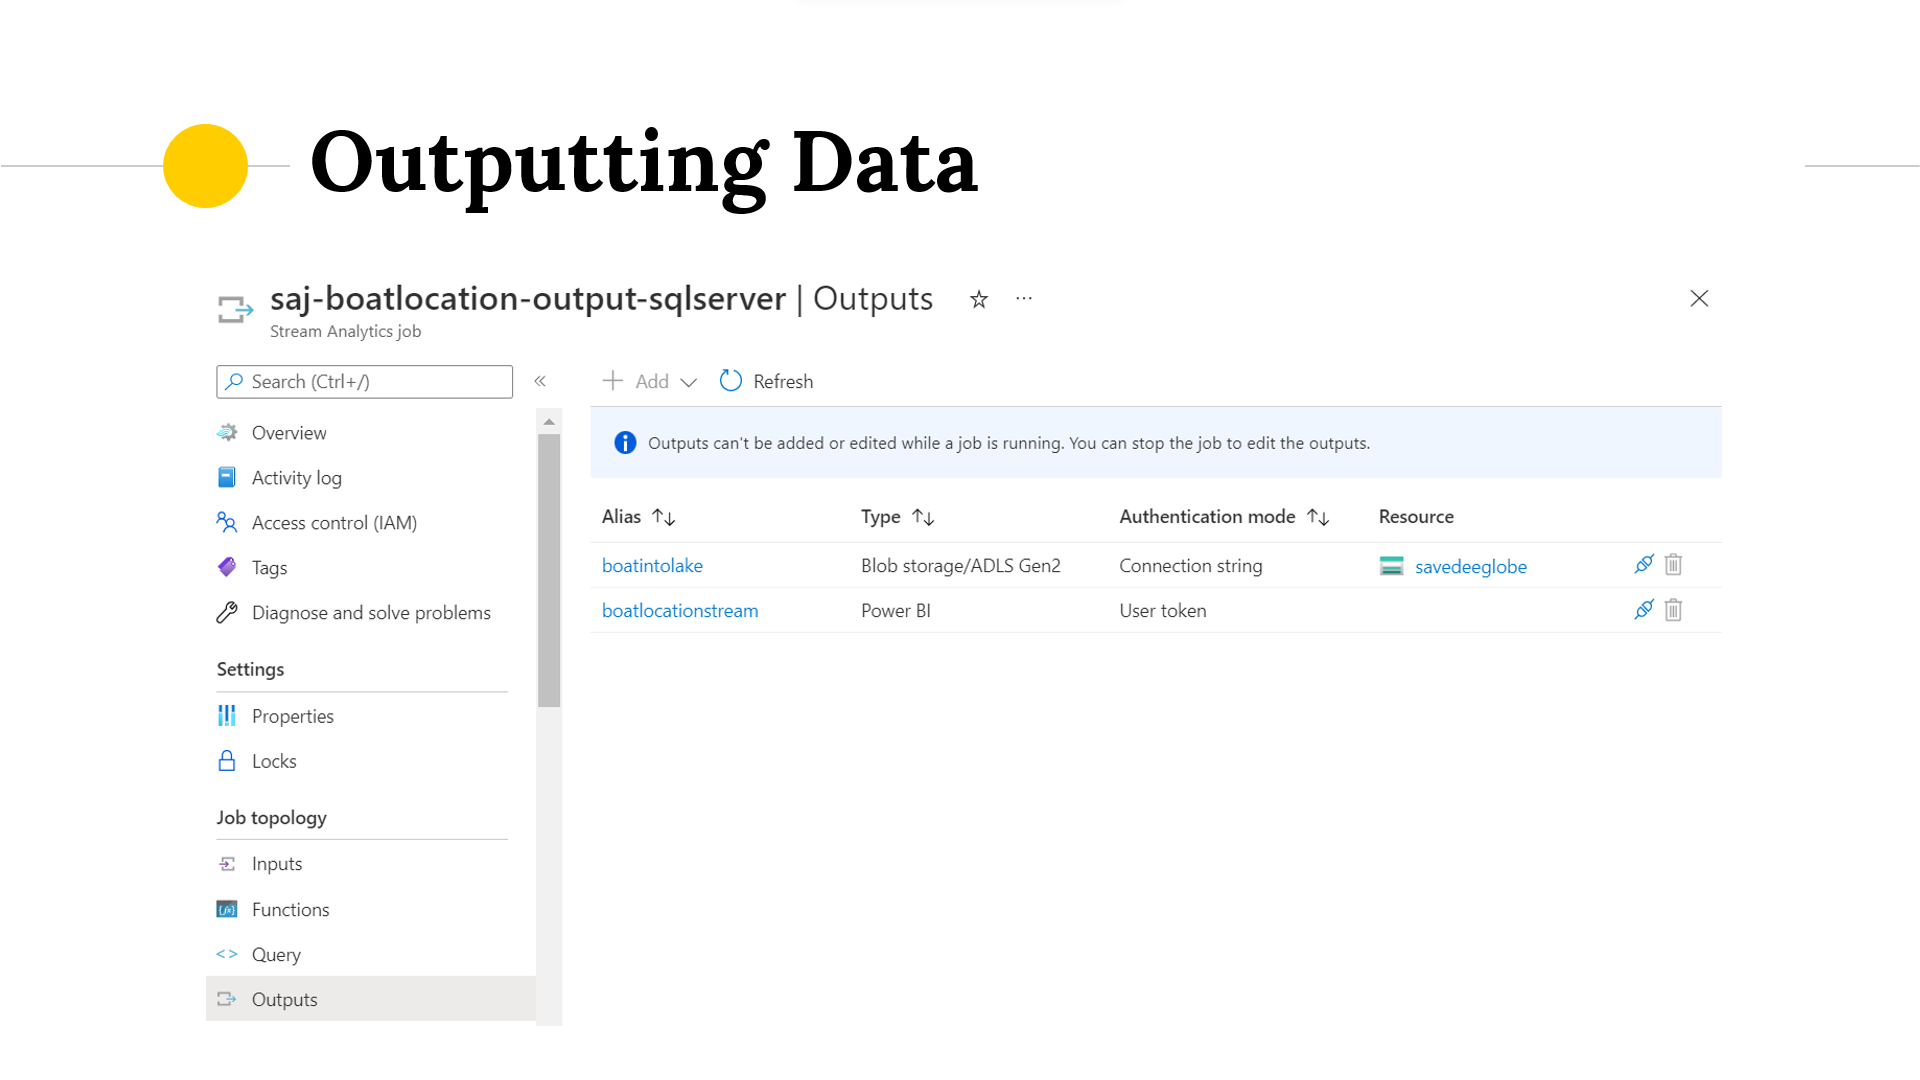
In Azure Stream Analytics we created a streaming job with two outputs
boatintolake is saving the data in the cool tier ADLS Gen2
boatlocationstream is our real time stream to Power BI service.In Power BI I used RouteMap visualisation to display the real time location and route taken for each boat
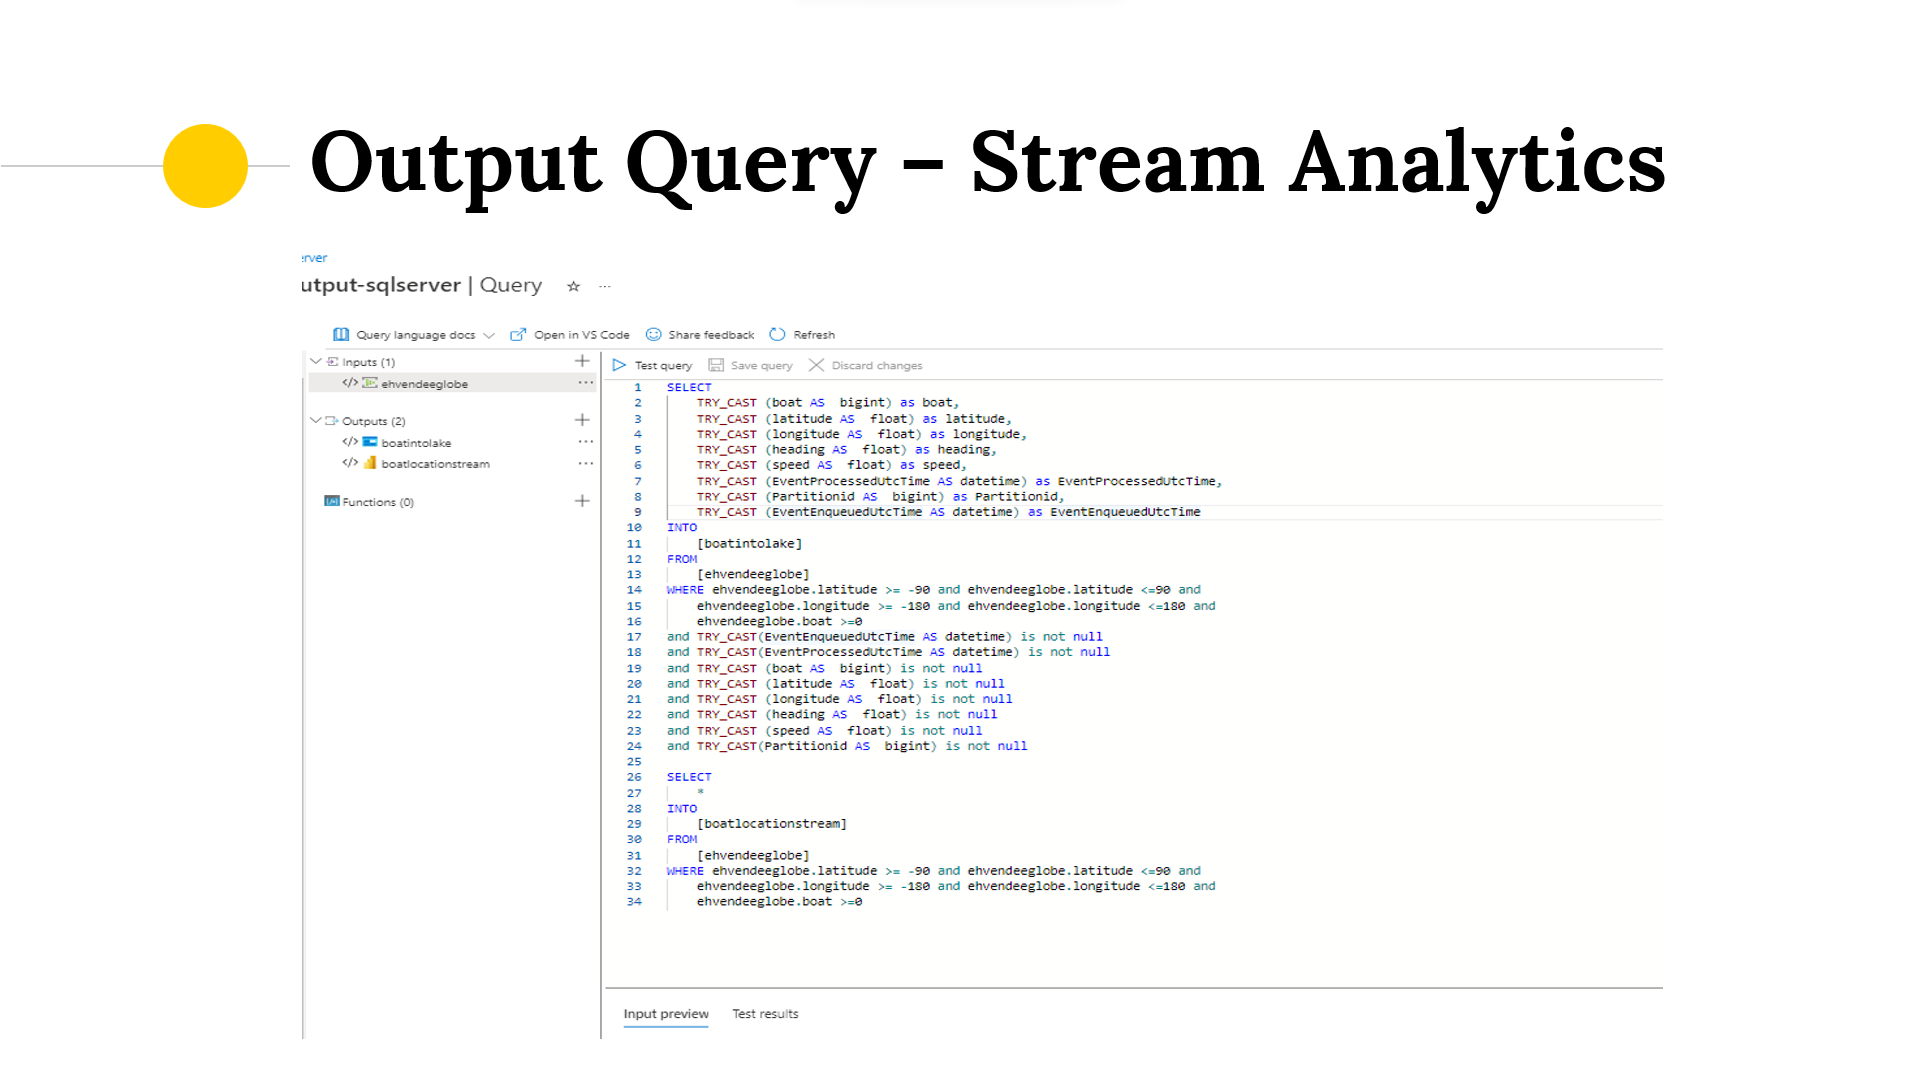
Each output required a query and it is here that I handled the invalid data that was been streamed. As you can see from this screen both queries exclude any rows with invalid longitute or latitude values.
For the batch stream to ADLS Gen2 I also had to CAST the values as some values where been stored as Integers and were causing issues when I imported the data to Power Bi desktop. TRY_CAST function , which is similar to the CAST Function, is used to convert an expression from one data type to another. If it succeeds, then SQL TRY CAST will return the expression in the desired data type. Otherwise, it will return null. Its for this reason we then only select rows that are not null
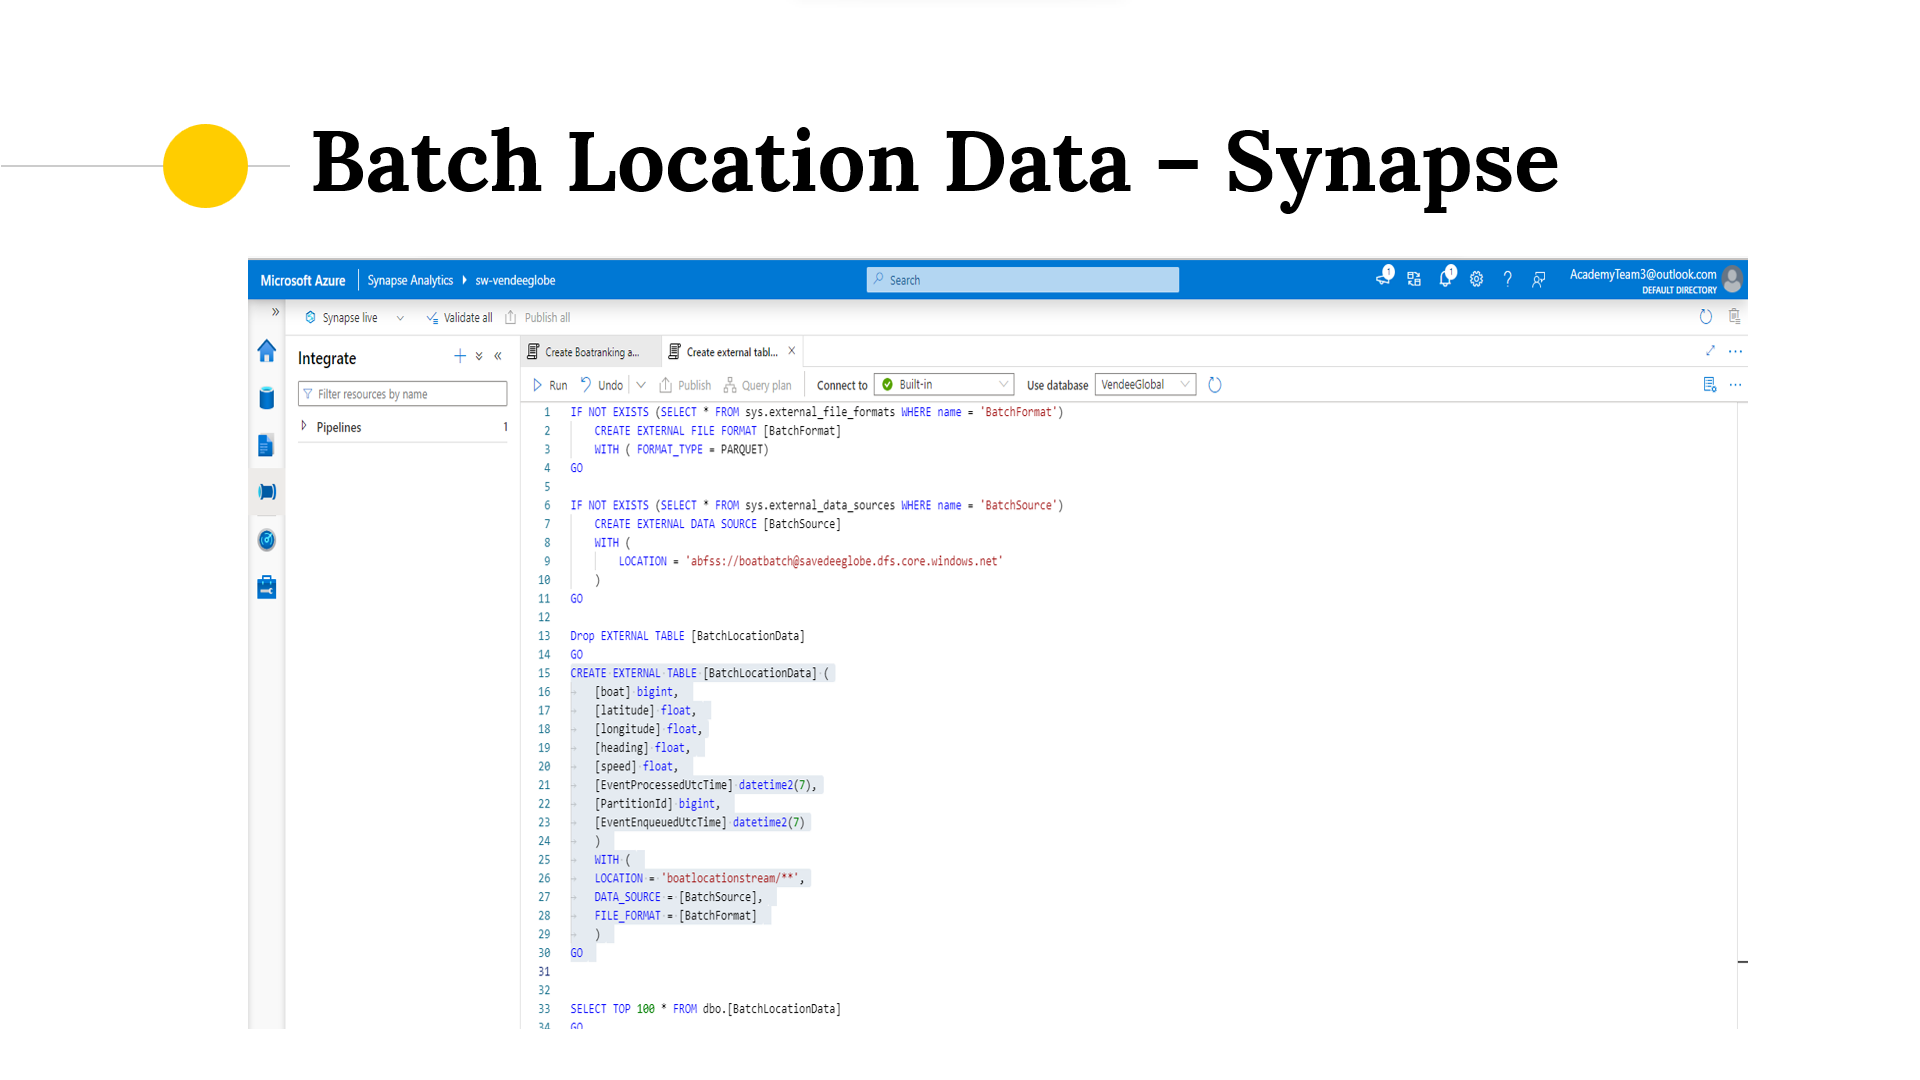
In Synapse I created an external table using serverless pools. Serverless pools where used as they are low cost solution and allowed us to integrate easily to Power Bi Desktop
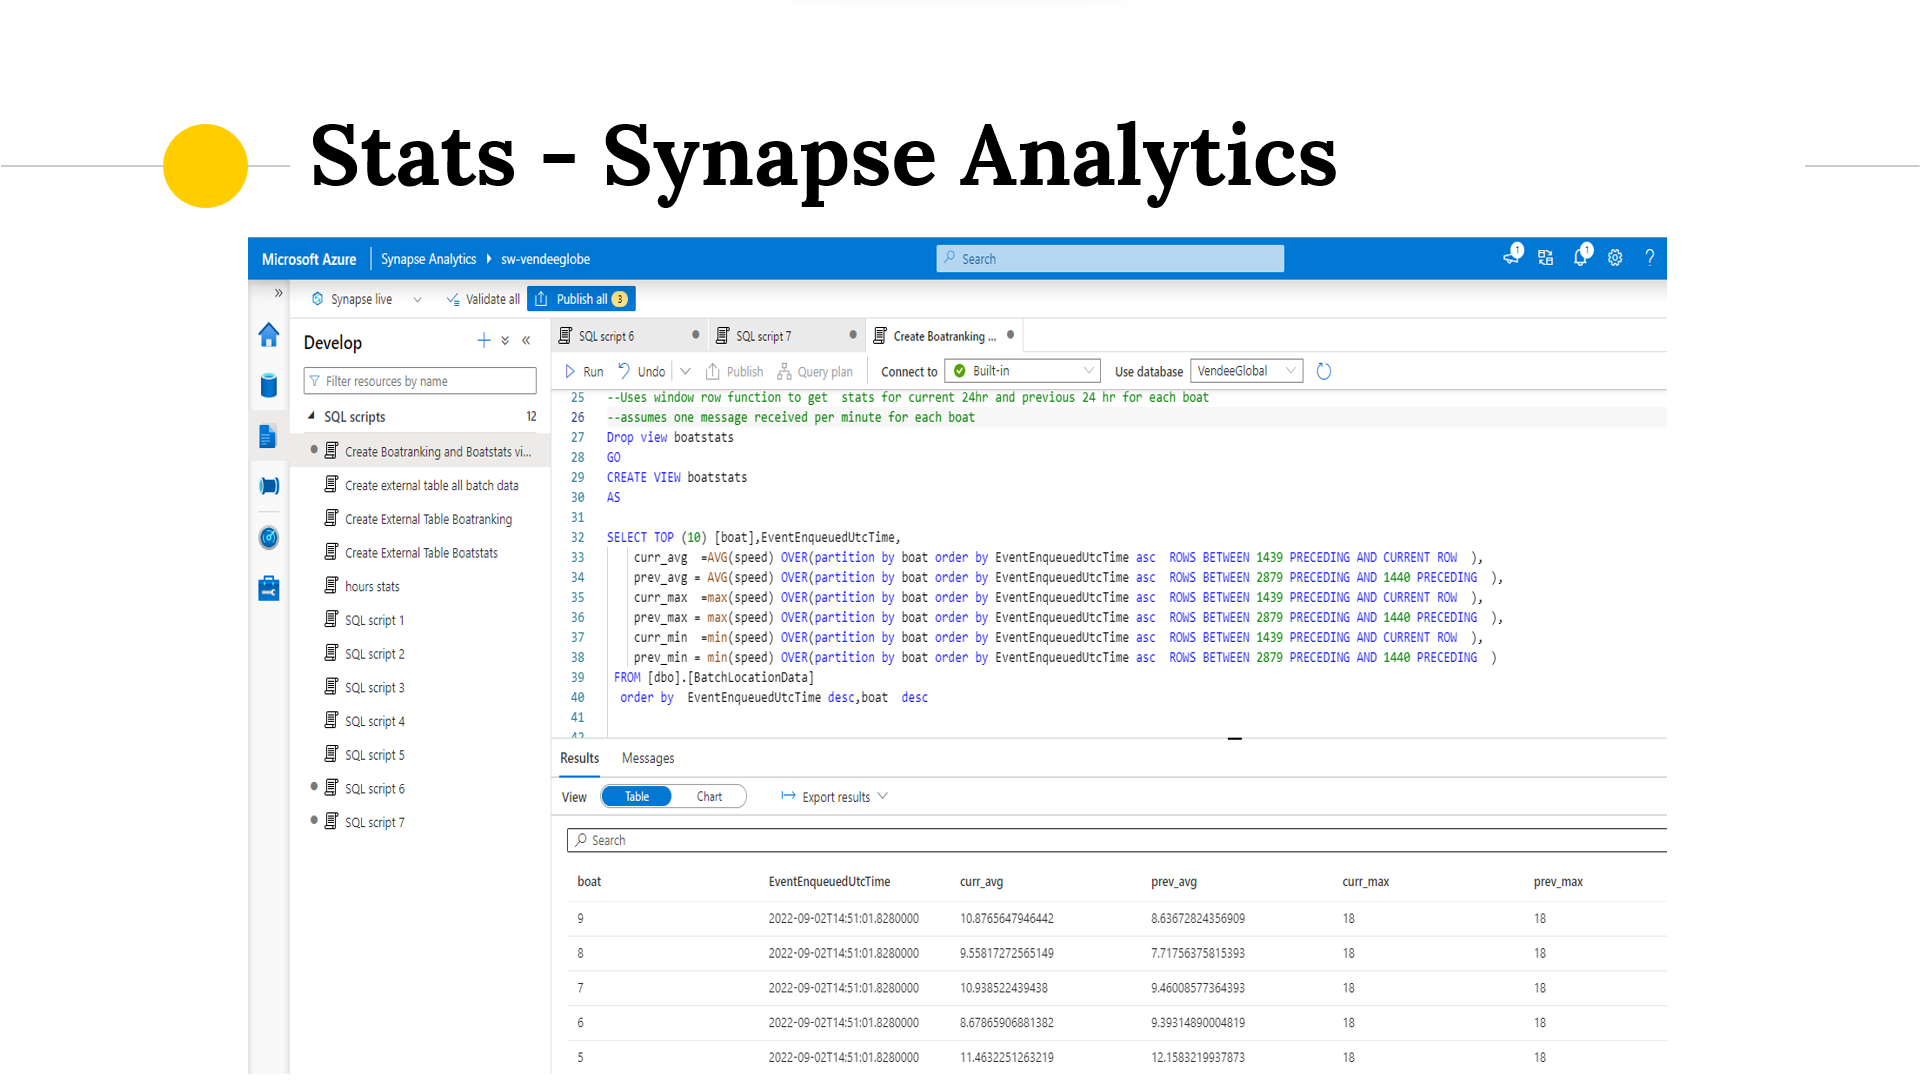
Using this external table then created a view to get speed statistics for each boat. A window row function was used to get the stats for each boat for last 24 hours and previous 24 hours. The query used assumes one message received per minute for each boat. We chose to look at only 48 hours of data as our similator was only running for a few days but if running longer this query could be adjusted to look at weekly or monthly statistics.
![]()
Again using the external table created a view which was then used to rank the boats. This view uses the average starting point for all boats as the starting position and calculates the distance traveled from this point to their last captured location.
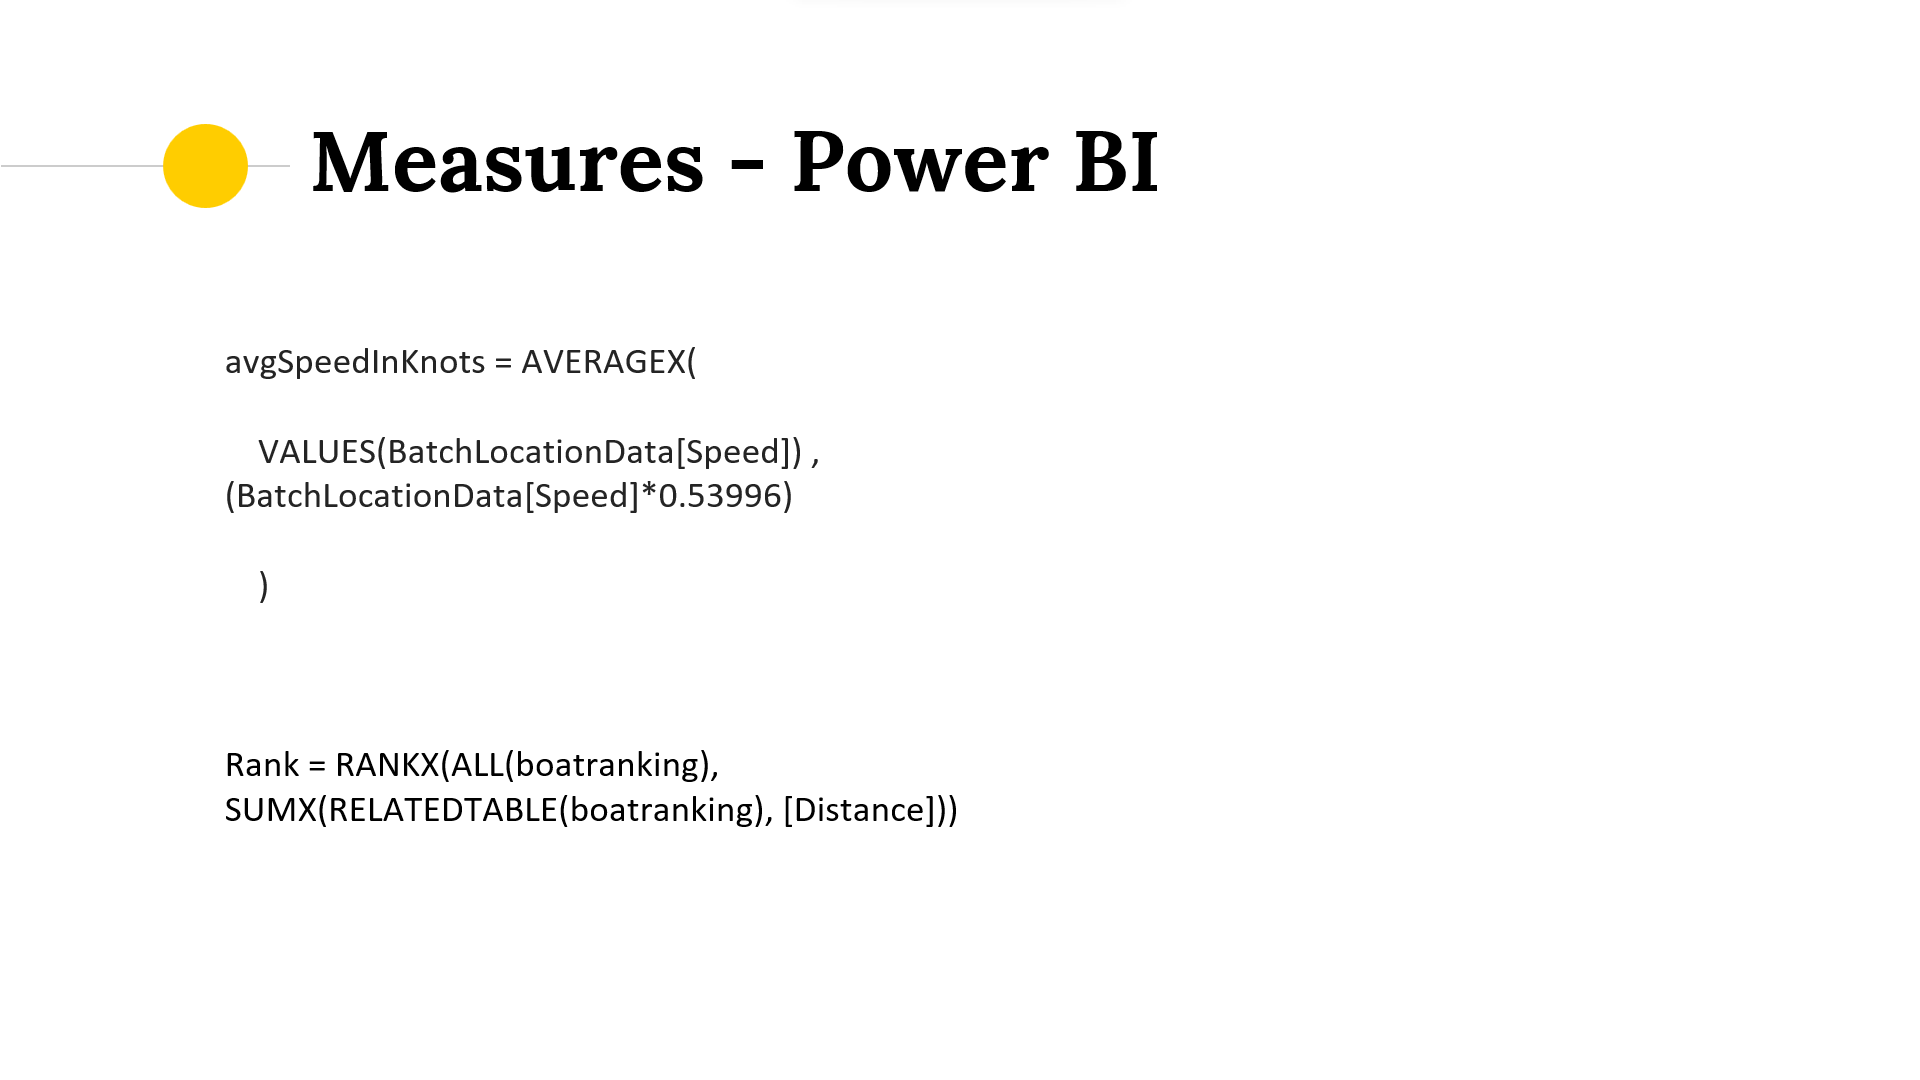
In Power Bi Desktop we then got this data from Synapse using direct query. Two measures where created
avgspeedinknots converted the distance traveled to knots. I thought the users of this dashboard would appreciate seeing nautical values!
Rank - ranked the boats by distance traveled
Visualisations where created using these measures and the data from Synapse and then published to Power Bi Service
Completed Dashboard